OPEN-SOURCE SCRIPT
Loro Vola Stop with RSI
Обновлено
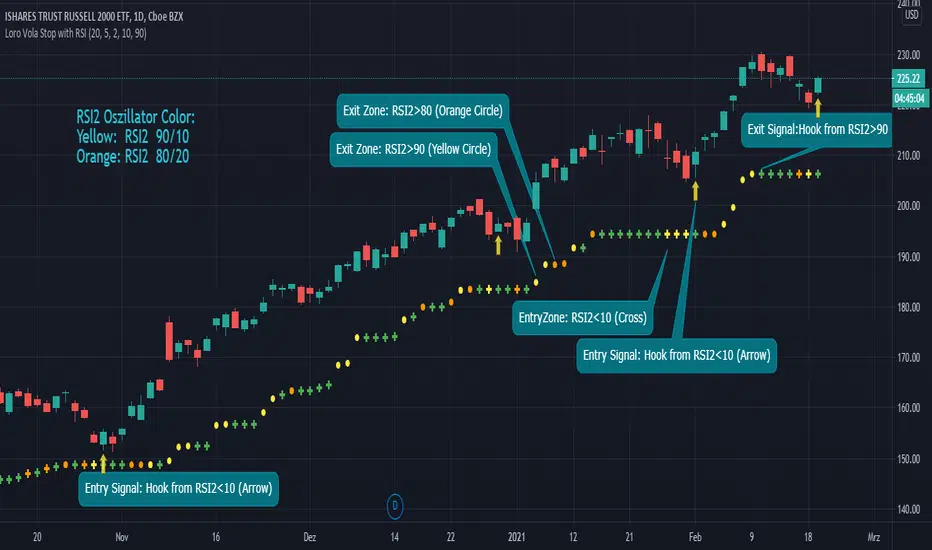
This script shows the trend of an underlying based on a variation of the „Chandelier Stop" script from pipCharlie on TradingView.
Within the trend possible entry/exit zones are shown based on RSI2 overbought/oversold condition.
This type of trading setup is heavily used in the community of LoroTrader in Internet.
*Input Indicators:
- Trend Indicator:
VolaStop: Lookback Period, Multiplikator
- Oscillator Indicator:
RSI, RSI Upper-/Lowerlimit
- Display Control:
Display RSI Exit y/n ... Display ExitZone with green/red circles
Display RSI Confirmed Exit y/n ... Display EntrySignals after RSI hook from extrem with red/green arrows
*Output:
- Trend Indicator:
Green/red cross: VolaStop level
- Oscillator Zones:
Yellow cross: Pullback within trend
Green/red circles: Overbought/Sold zones
- Entry Signals:
Hook from extrem in trend direction
Информация о релизе
Change ExitZone colorAdd warning color orange
Информация о релизе
Use close instead of high/low for stop calculationСкрипт с открытым кодом
В истинном духе TradingView автор этого скрипта опубликовал его с открытым исходным кодом, чтобы трейдеры могли понять, как он работает, и проверить на практике. Вы можете воспользоваться им бесплатно, но повторное использование этого кода в публикации регулируется Правилами поведения. Вы можете добавить этот скрипт в избранное и использовать его на графике.
Отказ от ответственности
Все виды контента, которые вы можете увидеть на TradingView, не являются финансовыми, инвестиционными, торговыми или любыми другими рекомендациями. Мы не предоставляем советы по покупке и продаже активов. Подробнее — в Условиях использования TradingView.