PROTECTED SOURCE SCRIPT
Daily Seasonality [YuL]
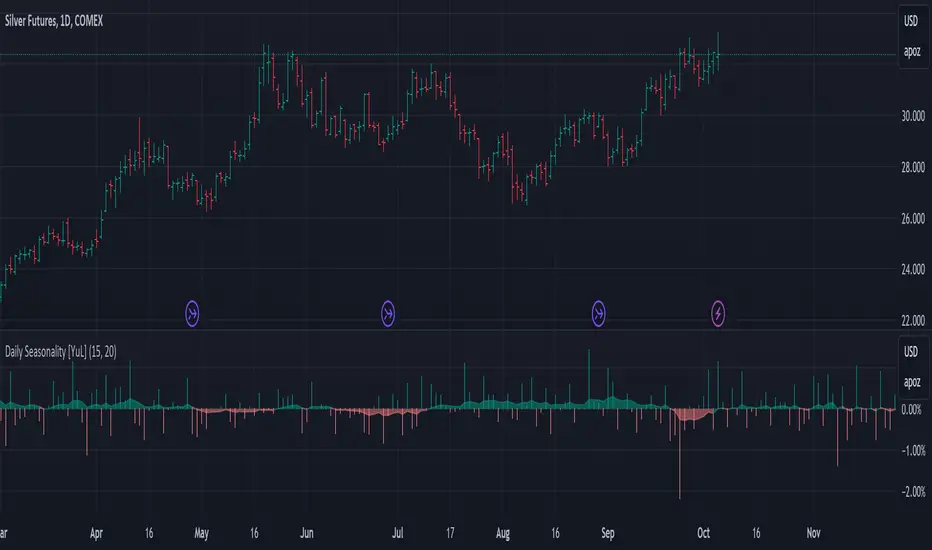
This indicator calculates average returns for trading days across specified number of years in the past and displays this as a histogram. In addition, it displays EMA of these values as filled area plot.
Indicator uses ordinal number of trading day in a year, i.e. January 3rd may be 1st trading day, January 4th - 2nd trading day, etc.
Large green or red areas may mean that there is a strong seasonal factor at these dates that may support, launch, or break a trend.
It only works on daily timeframe at the moment. Maximum number of years it can look back is 15.
Yuri Lopukhov [YuL]
Отказ от ответственности
Все виды контента, которые вы можете увидеть на TradingView, не являются финансовыми, инвестиционными, торговыми или любыми другими рекомендациями. Мы не предоставляем советы по покупке и продаже активов. Подробнее — в Условиях использования TradingView.