OPEN-SOURCE SCRIPT
Brooks 18 Bars [KintsugiTrading]
Brooks 18 Bars
Overview:
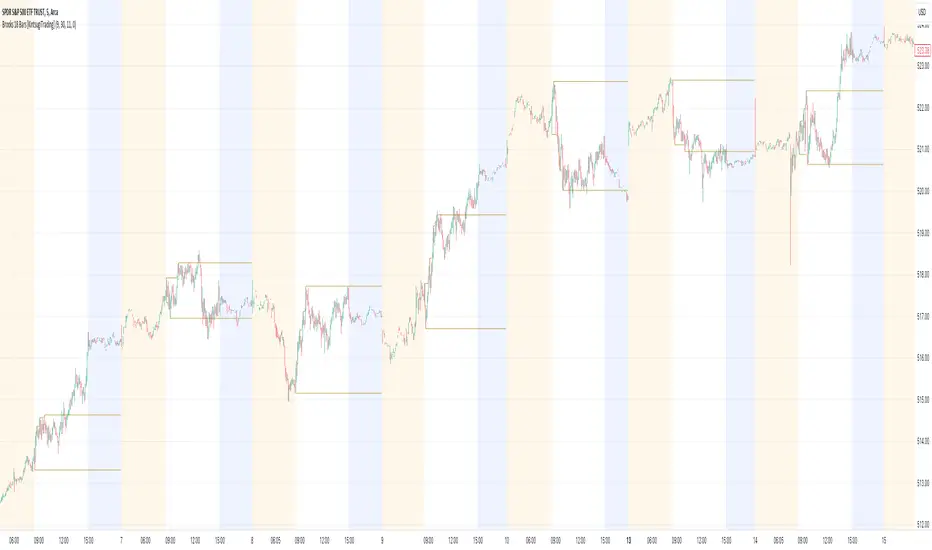
This indicator allows traders to specify a time frame within each trading day and plots lines at the highest and lowest prices recorded during that period. It is particularly useful for identifying key levels of support and resistance within a specified time range.
Features:
How to Use:
Set the Time Frame:
Analyze Key Levels:
Al Brooks popularized the following idea and basis for creating this indicator:
Use the plotted lines to identify significant support and resistance levels within your specified time frame. These levels can help inform your trading decisions, such as entry and exit points.
Good luck with your trading!
Overview:
This indicator allows traders to specify a time frame within each trading day and plots lines at the highest and lowest prices recorded during that period. It is particularly useful for identifying key levels of support and resistance within a specified time range.
Features:
- User-Defined Time Frame: Traders can input their desired start and end times in a 24-hour format, allowing flexibility to analyze different market sessions.
- High and Low Price Levels: The indicator plots lines representing the highest and lowest prices observed within the specified time frame each day.
- Clear Visual Representation: The high and low lines are color-coded for easy identification, with the high & low prices in Kintsugi Trading Gold.
How to Use:
Set the Time Frame:
- Adjust the "Start Time Hour" and "Start Time Minute" to define the beginning of your desired time frame.
- Adjust the "End Time Hour" and "End Time Minute" to define the end of your desired time frame.
Analyze Key Levels:
Al Brooks popularized the following idea and basis for creating this indicator:
- On a 5-minute chart, Bar 1 has a 20-30% chance of being the High or Low of the day.
- Bar 12 has a 50% chance.
- Bar 18 has an 80-90% chance.
Use the plotted lines to identify significant support and resistance levels within your specified time frame. These levels can help inform your trading decisions, such as entry and exit points.
Good luck with your trading!
- Jay -
KintsugiTrading@gmail.com
KintsugiTrading.com
KintsugiTrading@gmail.com
KintsugiTrading.com
Скрипт с открытым кодом
В истинном духе TradingView автор этого скрипта опубликовал его с открытым исходным кодом, чтобы трейдеры могли понять, как он работает, и проверить на практике. Вы можете воспользоваться им бесплатно, но повторное использование этого кода в публикации регулируется Правилами поведения. Вы можете добавить этот скрипт в избранное и использовать его на графике.
Отказ от ответственности
Все виды контента, которые вы можете увидеть на TradingView, не являются финансовыми, инвестиционными, торговыми или любыми другими рекомендациями. Мы не предоставляем советы по покупке и продаже активов. Подробнее — в Условиях использования TradingView.