OPEN-SOURCE SCRIPT
[GB]Commodity Futures Map
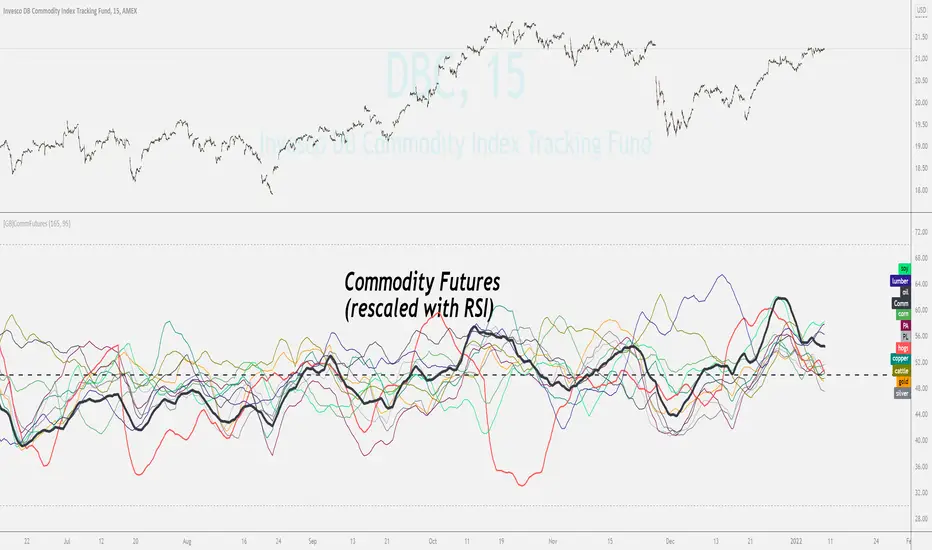
Puts numerous commodity futures on the same scale. The main function is RSI (without evoking "oversold/bought" concepts).
Reading the chart: Much like any oscillator, the important elements are:
Position relative to the middle
*
Settings:
May add value when asking questions like:
Is lumber trending?
Is silver trending faster than gold?
Is the entire asset class trending up down or not at all?
Adding additional symbols is easy since the code for each symbol is identical.
Reading the chart: Much like any oscillator, the important elements are:
Position relative to the middle
- Slope
Momentum
Volatility
*
Settings:
- RSI length
EMA smoothing
Time Frame (of the indicator, not the chart(
May add value when asking questions like:
Is lumber trending?
Is silver trending faster than gold?
Is the entire asset class trending up down or not at all?
Adding additional symbols is easy since the code for each symbol is identical.
Скрипт с открытым кодом
В истинном духе TradingView автор этого скрипта опубликовал его с открытым исходным кодом, чтобы трейдеры могли понять, как он работает, и проверить на практике. Вы можете воспользоваться им бесплатно, но повторное использование этого кода в публикации регулируется Правилами поведения. Вы можете добавить этот скрипт в избранное и использовать его на графике.
Отказ от ответственности
Все виды контента, которые вы можете увидеть на TradingView, не являются финансовыми, инвестиционными, торговыми или любыми другими рекомендациями. Мы не предоставляем советы по покупке и продаже активов. Подробнее — в Условиях использования TradingView.