PROTECTED SOURCE SCRIPT
Kaya RSI BASED INFLATION INDICATOR
Обновлено
Use your own risk.
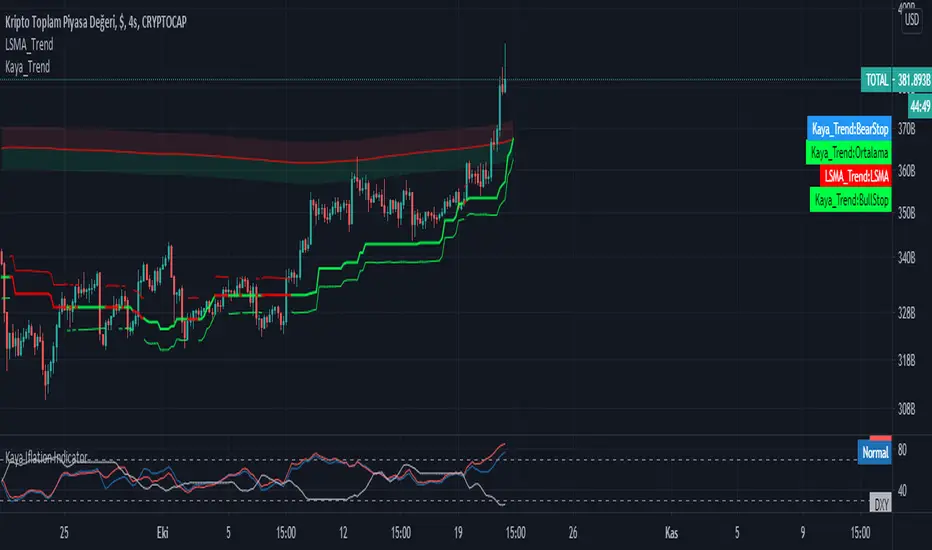
This indicator aims look inflation of your emita according to the BTC and XAU. Also you can use Dxy too. The main idea of behind of this indicator is rsi. But not normal rsi :).
For example. If green(XAU) line upper then xau going to up better than BTC and your emita. If red line (BTC) is upper, thats mean buying BTC can be more profitably. Blue line (named Normal means this is your emita) is upper that mean your emita is can be more profitably than the others. You can think opposite for lower situations.
Be aware this is not mean percent rising or declining. This is just understanding for which of them (relatively) moving how according to the rsi.
Maybe it can using for positons too. But I didnt test it. So be carefull.
Best Regards.
Информация о релизе
Marketcap of USDT Added. Be aware,
There is Rsi in calculations and you can choose your rsi period.
But this isnt mean this lines is rsi. There is also moving avarage calculation in this indicator.
If you have a question or an opinion contct with me.
Информация о релизе
UKOIL and ETH added. Информация о релизе
You can use any emita in this indicator. BTC, XAU, SP500, DXY, UKOIL, ETH and USDT.
Just choose them from Stil.
Информация о релизе
USDCHF added.And dont forget Normal mean your emita on the chart.
Информация о релизе
Colors changed.Информация о релизе
SPX changed with US500 for gaps.Информация о релизе
EURUSD added to pairs enjoy it...Информация о релизе
USDTRY added.Информация о релизе
GBPUSD, YFIUSDT, CRYPTOCAP:TOTAL added enjoy it. Отказ от ответственности
Все виды контента, которые вы можете увидеть на TradingView, не являются финансовыми, инвестиционными, торговыми или любыми другими рекомендациями. Мы не предоставляем советы по покупке и продаже активов. Подробнее — в Условиях использования TradingView.