PROTECTED SOURCE SCRIPT
Find overbought / oversold Value line
Обновлено
HI, this is Yong from MBY_LAB.
this codes can help you how save the Values when Crossover or Cross lines each difference lines.
first of all, this codes based on Relative Strength line (RSI).
when the RSI located 20 or 80 lines (it's means over sold/bought), it's show the price on your charts.
can everyone use this.
enjoy.
May the
Bit be with
You.
//
explanation ---
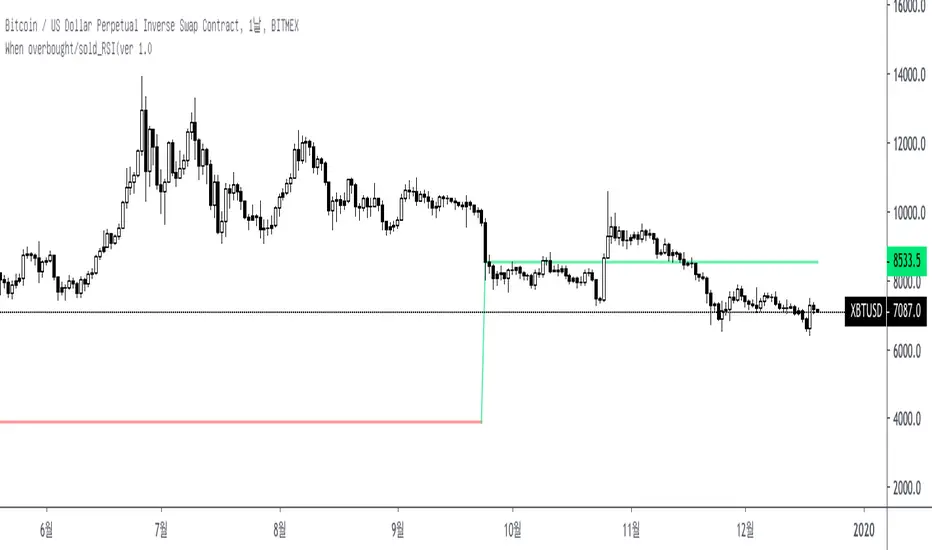
on chart = value when under 20 or over 80 RSI
under Oscillator = about "RSI" when under 20 or over 80 RSI
this codes can help you how save the Values when Crossover or Cross lines each difference lines.
first of all, this codes based on Relative Strength line (RSI).
when the RSI located 20 or 80 lines (it's means over sold/bought), it's show the price on your charts.
can everyone use this.
enjoy.
May the
Bit be with
You.
//
explanation ---
on chart = value when under 20 or over 80 RSI
under Oscillator = about "RSI" when under 20 or over 80 RSI
Информация о релизе
change line color.Информация о релизе
update.now users can change print out price source.
close/open/ hlc3.. etc.,
Информация о релизе
changed logic.overbought & sold condition.
Информация о релизе
version update. ver 1.0
TraderWagon : traderwagon.com/en/portfolio/5658?ref=zoh7j9m
telegram: t.me/mbylab_official
Invite Only scripts contact : telegram @yong9205
telegram: t.me/mbylab_official
Invite Only scripts contact : telegram @yong9205
Отказ от ответственности
Все виды контента, которые вы можете увидеть на TradingView, не являются финансовыми, инвестиционными, торговыми или любыми другими рекомендациями. Мы не предоставляем советы по покупке и продаже активов. Подробнее — в Условиях использования TradingView.