OPEN-SOURCE SCRIPT
RSI Pacing
Обновлено
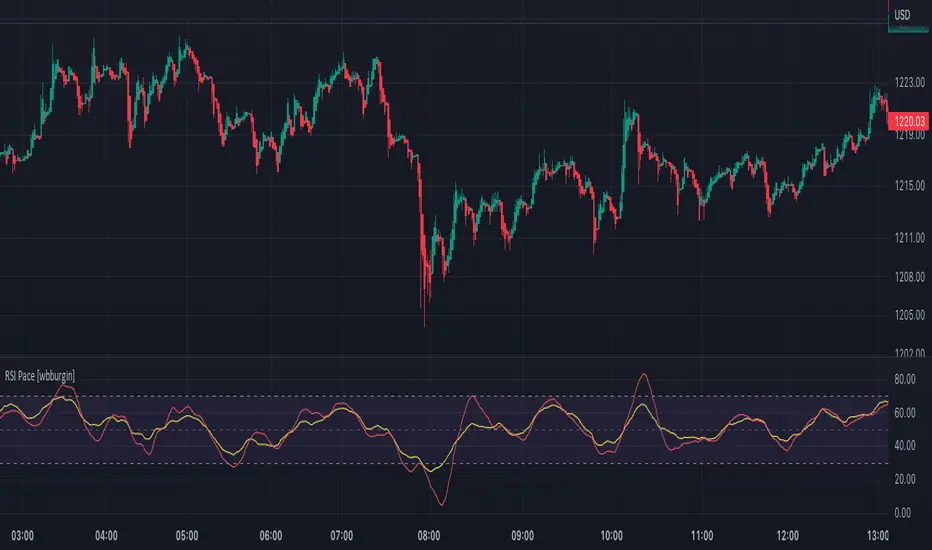
The RSI Pacing indicator compares the movement of the RSI directly with the movement of the asset to help identify divergences.
Bullish Divergences
Bearish Divergences
Warning: Does not yet work on higher timeframes yet. Working on getting the pace normalized to the RSI's bounds.
Bullish Divergences
- The RSI is increasing at a greater rate than the pace of the asset.
- The RSI is decreasing at a lesser rate than the pace of the asset.
Bearish Divergences
- The RSI is decreasing at a greater rate than the pace of the asset.
- The RSI is increasing at a lesser rate than the pace of the asset.
Warning: Does not yet work on higher timeframes yet. Working on getting the pace normalized to the RSI's bounds.
Информация о релизе
Adjusted pace calculation to be relevant in all timeframes.Информация о релизе
Adjustments to interfaceИнформация о релизе
Adjusted defval for lookback to make indicator less sensitive to abrupt fluctations.Информация о релизе
Separated PaceMA from RSIMAИнформация о релизе
Updated Overbought/Oversold lines to be consistent with normalized RSI bounds.Информация о релизе
Added visual that shows the difference between the RSI and the pace.Скрипт с открытым кодом
В истинном духе TradingView автор этого скрипта опубликовал его с открытым исходным кодом, чтобы трейдеры могли понять, как он работает, и проверить на практике. Вы можете воспользоваться им бесплатно, но повторное использование этого кода в публикации регулируется Правилами поведения. Вы можете добавить этот скрипт в избранное и использовать его на графике.
FAQ: I am gradually phasing out my Patreon because of the time it takes to maintain.
BTC: 35PdMMMXFCvPjXKwn8wsRFNwMEPgStaKUJ
Test my strategies on CryptoRobotics: cryptorobotics.co/?trade=f23b09
BTC: 35PdMMMXFCvPjXKwn8wsRFNwMEPgStaKUJ
Test my strategies on CryptoRobotics: cryptorobotics.co/?trade=f23b09
Отказ от ответственности
Все виды контента, которые вы можете увидеть на TradingView, не являются финансовыми, инвестиционными, торговыми или любыми другими рекомендациями. Мы не предоставляем советы по покупке и продаже активов. Подробнее — в Условиях использования TradingView.