OPEN-SOURCE SCRIPT
High Low Differential Meter
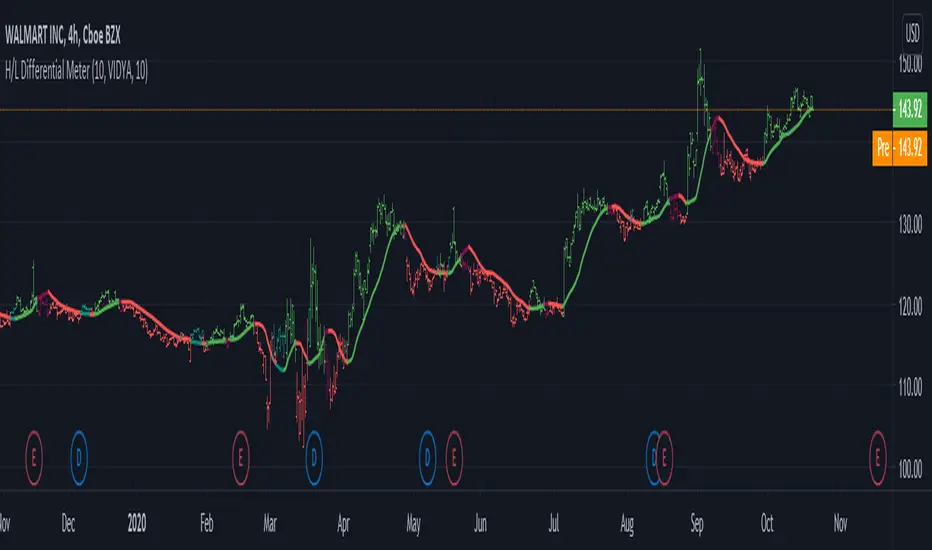
Yet another trend follower that is based on a very simple principle: Take the highest high and lowest low from a user defined bars back period, do an average between them and smooth them up with 3 possible moving averages, VIDYA, EMA and SMA, while VIDYA is the default.
What is VIDYA ?
Variable Index Dynamic Average (VIDYA) is similar to the Exponential Moving Average (EMA), but automatically adjusts the smoothing weight based on price volatility.
How to use:
GREEN : Up trending
LIGHT GREEN : Up trend reversal might occur.
RED : Down trending
LIGHT RED : Down trend reversal might occur.
NOTE: BAR COLORS are set to TRUE by default!
Follow for more indicators: tradingview.com/u/dman103/
Appreciation of my work: paypal.me/dman103
Premium Pivot Points Algo Indicator: tradingview.com/script/LFBaHNuA-Pivot-Points-Algo/
LIVE Stream - Pivot Points Algo: youtube.com/channel/UCFyqab-i0xb2jf-c18ufH0A/live
Premium Pivot Points Algo Indicator: tradingview.com/script/LFBaHNuA-Pivot-Points-Algo/
LIVE Stream - Pivot Points Algo: youtube.com/channel/UCFyqab-i0xb2jf-c18ufH0A/live
Скрипт с открытым кодом
В истинном духе TradingView автор этого скрипта опубликовал его с открытым исходным кодом, чтобы трейдеры могли понять, как он работает, и проверить на практике. Вы можете воспользоваться им бесплатно, но повторное использование этого кода в публикации регулируется Правилами поведения. Вы можете добавить этот скрипт в избранное и использовать его на графике.
Отказ от ответственности
Все виды контента, которые вы можете увидеть на TradingView, не являются финансовыми, инвестиционными, торговыми или любыми другими рекомендациями. Мы не предоставляем советы по покупке и продаже активов. Подробнее — в Условиях использования TradingView.