OPEN-SOURCE SCRIPT
OBV High / LOW (On-Balance Volume )
Обновлено
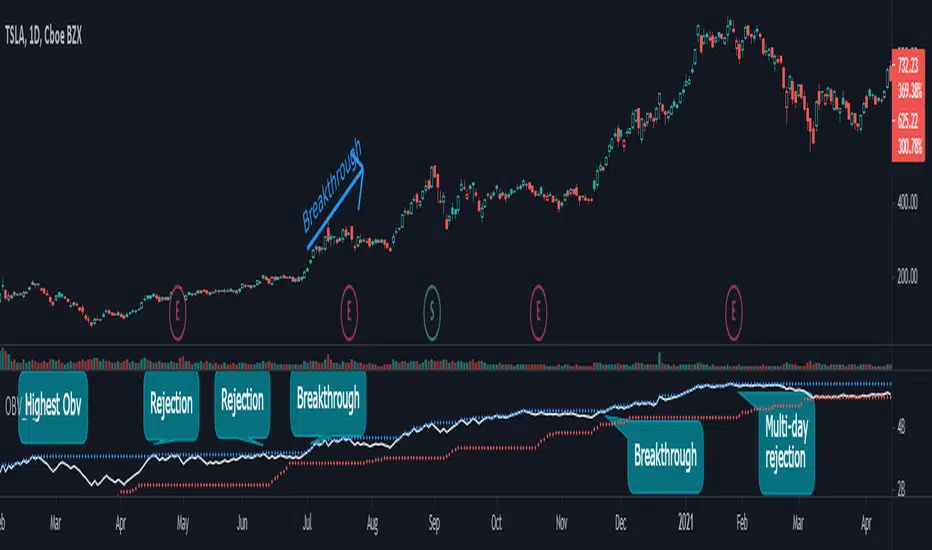
This is a simple application of OBV indicator (On-Balance Volume ), to visually determine when a given stock current obv is near the highest or lowest based on the number of lookback bars.
Indicator examples:
### OBV value is near an all-time high ##
Example

Inputs
Notes:
OBV information
https://www.investopedia.com/terms/o/onbalancevolume.asp
Comments:
This is my first script any ideas, suggestions, or detected errors (language/script) don´t hesitate to send a message.
Best regards, Mauro.
Indicator examples:
### OBV value is near an all-time high ##
- breakthrough, stock value could set new all-time highs.
- rejection, stock value could come down or consolidate.
Example
Inputs
- OBV High Lookback -> numbers of bars to look back for the obv high.
- OBV LowLookback -> numbers of bars to look back for the obv low.
- OBV EMA Length -> Ema length
Notes:
- This script also comes with an ema indicator based on obv for smoothing the obv signal since it gets noise at lower timeframes (by default comes disabled)
OBV information
https://www.investopedia.com/terms/o/onbalancevolume.asp
Comments:
This is my first script any ideas, suggestions, or detected errors (language/script) don´t hesitate to send a message.
Best regards, Mauro.
Информация о релизе
Minor fix : Change OBV plot color from white to yellow to fix white theme problemСкрипт с открытым кодом
В истинном духе TradingView автор этого скрипта опубликовал его с открытым исходным кодом, чтобы трейдеры могли понять, как он работает, и проверить на практике. Вы можете воспользоваться им бесплатно, но повторное использование этого кода в публикации регулируется Правилами поведения. Вы можете добавить этот скрипт в избранное и использовать его на графике.
Отказ от ответственности
Все виды контента, которые вы можете увидеть на TradingView, не являются финансовыми, инвестиционными, торговыми или любыми другими рекомендациями. Мы не предоставляем советы по покупке и продаже активов. Подробнее — в Условиях использования TradingView.