Dow Jones (DJI) Double Top (Strong Incoming Drop Closer)
Обновлено

The Dow Jones Industrial Average Index (DJI) is getting closer to a strong drop.
Last time we looked at divergence, the same as with the S&P 500 Index as these charts are almost identical. Today we will be looking at a double top formation plus the same signals we saw on the SPX MACD.
Let's get started... Perhaps you want to hit LIKE now before moving on...
Thanks a lot for the support.
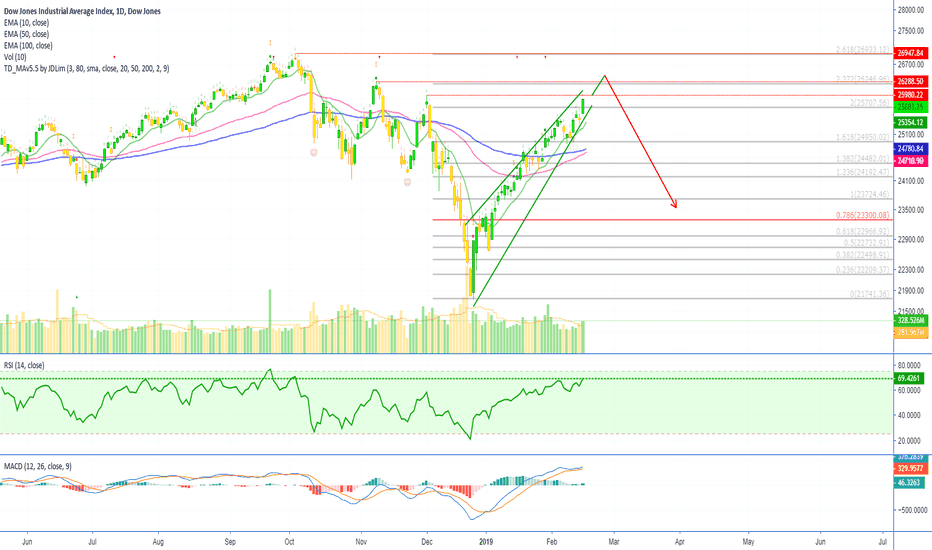
Dow Jones Industrial Average Index (DJI) Chart Analysis
Next, we look at the MACD, here is a screenshot:
As you can see, these signals, coupled with the bearish divergence we saw in my previous analysis, all point to an upcoming crash.
What's your take on the Dow Jones Industrial Average Index (DJI), will it crash or continue moving up?
Leave your thoughts in the comments section below.
Namaste.
Last time we looked at divergence, the same as with the S&P 500 Index as these charts are almost identical. Today we will be looking at a double top formation plus the same signals we saw on the SPX MACD.
Let's get started... Perhaps you want to hit LIKE now before moving on...
Thanks a lot for the support.
Dow Jones Industrial Average Index (DJI) Chart Analysis
- The double top is marked with yellow circles on the chart above. Double tops are normally followed by a drop. There is also a shooting star candlestick on the second 'top'.
Next, we look at the MACD, here is a screenshot:
- MACD Histogram is moving in favor of the bears.
- MACD Bearish crossover.
As you can see, these signals, coupled with the bearish divergence we saw in my previous analysis, all point to an upcoming crash.
What's your take on the Dow Jones Industrial Average Index (DJI), will it crash or continue moving up?
Leave your thoughts in the comments section below.
Namaste.
Заметка
The weekly chart is even more telling. Here we can see the double top and rising wedge pattern: Previous analysis:
Заметка
Going according to the chart.Заметка
I will take another look at the Dow Jones.Заметка
Dow Jones (DJI) Hidden Bearish Divergence (Crash Ahead)
🔝 Daily Cryptocurrency Technical Analysis
followalan.com
🔥 PREMIUM Trade-Numbers (6-In-1 Offer Now Live!)
lamatrades.com (Since 2017)
🚨 Free PREMIUM Trade-Numbers
alansantanatrades.com
followalan.com
🔥 PREMIUM Trade-Numbers (6-In-1 Offer Now Live!)
lamatrades.com (Since 2017)
🚨 Free PREMIUM Trade-Numbers
alansantanatrades.com
Похожие публикации
Отказ от ответственности
Все виды контента, которые вы можете увидеть на TradingView, не являются финансовыми, инвестиционными, торговыми или любыми другими рекомендациями. Мы не предоставляем советы по покупке и продаже активов. Подробнее — в Условиях использования TradingView.