Bitcoin Definitely Moving Lower, At Least $9280, Weekly Analysis
Обновлено
We looked at Bitcoin short term (4H scale) and we saw it going lower... Now, we are looking at the weekly chart and it isn't looking good... But, before we get started... Feel free to hit like to show your support...
Namaste.
Bitcoin (1W) Chart Signals & Analysis
Yes... Bitcoin will move up... but only after moving lower... IT IS THE ALTCOINS TURN!
Want to know more?
Hit like on the image below...

Namaste.
Conditions for change: If BTCUSD moves and closes above the last high, the above signals are invalidated.
Namaste.
Bitcoin (1W) Chart Signals & Analysis
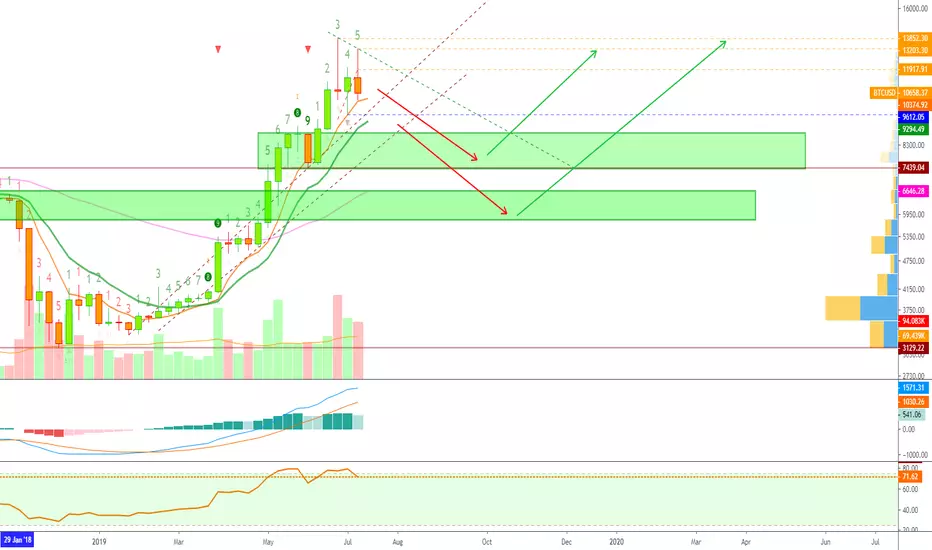
- We are looking at a lower high on the weekly time frame. This weeks candle is about to close.
- Notice the last two red candles, both have a long wick pointing down and above average (high) bear volume.
- Bitcoin grew from $3120 to $13,800+, after such grow, a retrace is as normal as it goes.
- The RSI hit its highest level since October 2017, it reached overbought and now is looking down and bearish.
Yes... Bitcoin will move up... but only after moving lower... IT IS THE ALTCOINS TURN!
Want to know more?
Hit like on the image below...
Namaste.
Conditions for change: If BTCUSD moves and closes above the last high, the above signals are invalidated.
Заметка
Thanks a lot for the support. We will share a new update soon.Namaste.
🔝 Daily Cryptocurrency Technical Analysis
followalan.com
🔥 PREMIUM Trade-Numbers (6-In-1 Offer Now Live!)
lamatrades.com (Since 2017)
🚨 Free PREMIUM Trade-Numbers
alansantanatrades.com
followalan.com
🔥 PREMIUM Trade-Numbers (6-In-1 Offer Now Live!)
lamatrades.com (Since 2017)
🚨 Free PREMIUM Trade-Numbers
alansantanatrades.com
Похожие публикации
Отказ от ответственности
Все виды контента, которые вы можете увидеть на TradingView, не являются финансовыми, инвестиционными, торговыми или любыми другими рекомендациями. Мы не предоставляем советы по покупке и продаже активов. Подробнее — в Условиях использования TradingView.